What is ENSO, and how can ocean anomalies control the weather?
Global weather is a very complex system. It is run by many small and large-scale factors, both in the ocean and the atmosphere. One of the most well-known oceanic influencers is without a doubt the ENSO or El Niño Southern Oscillation.
But what is ENSO, and how can it change the seasonal weather worldwide?
You will learn what the ENSO is and also just how strong of an influence these oceanic anomalies can force on the weather patterns, changing the course of weather on a global scale.
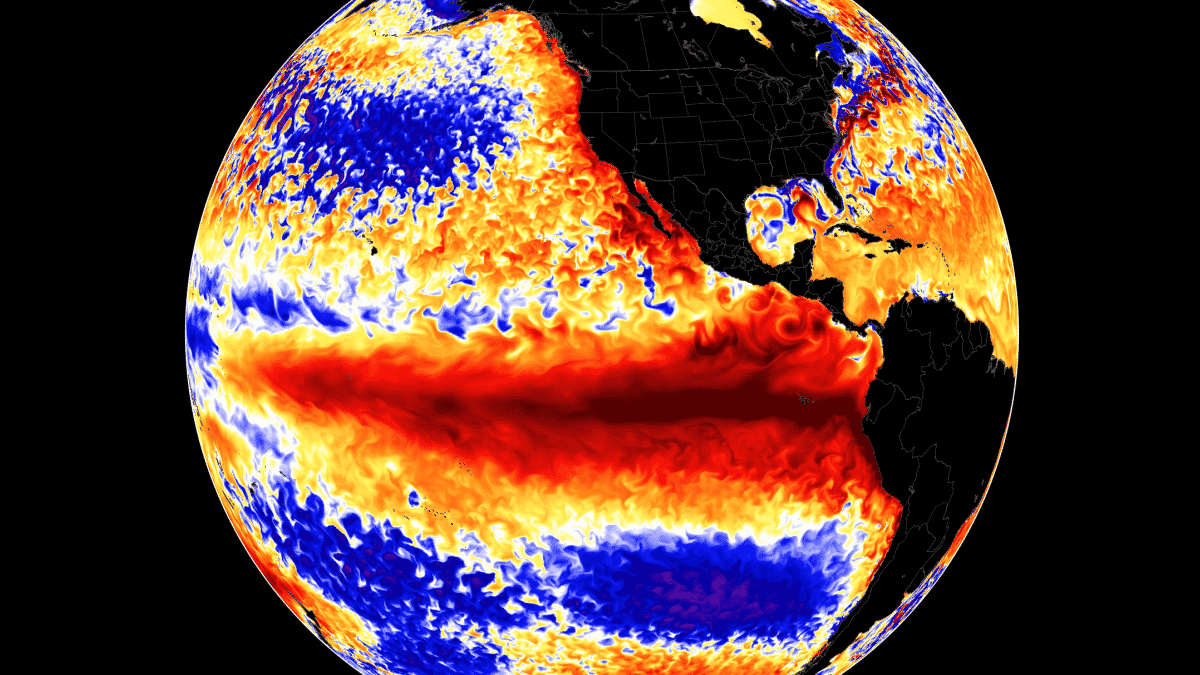
Below is an example of the strong 1997–98 El Niño event.
WHAT IS ENSO?
ENSO is short for “El Niño Southern Oscillation”. This is an oceanic temperature oscillation, changing between warm and cold phases across the equatorial Pacific Ocean. Typically there is a phase change roughly about every 1-3 years.
ENSO has a major influence on tropical rainfall patterns (storms) and impacts the complex relationship between the ocean and the atmosphere. We usually observe large-scale pressure changes in the tropics with each new developing phase. After some delay, these changes affect the circulation over the rest of the world.
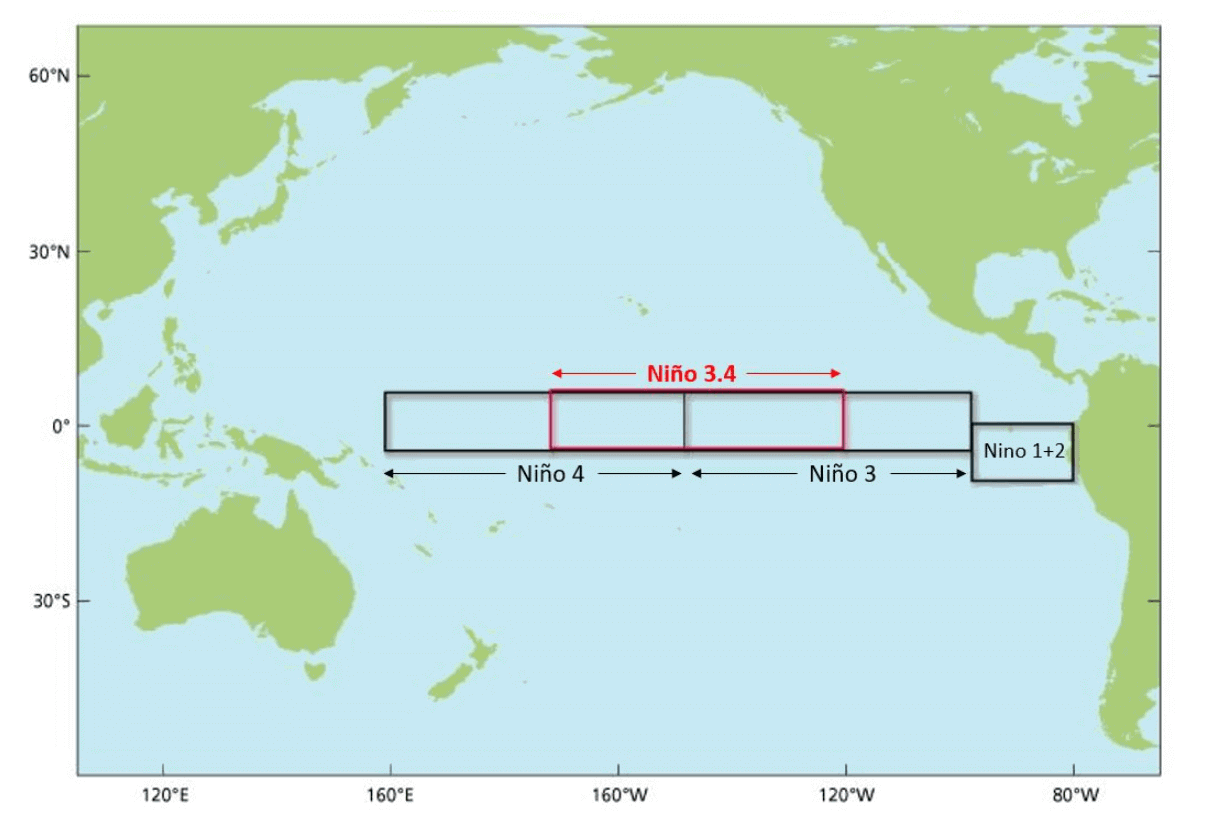
The image below shows the ENSO regions in the tropical Pacific. Regions 3 and 4 cover the east and west and together cover a large part of the tropical Pacific. Most analyses and forecasts are focused on a combination of regions 3 and 4, seen on the image as the main Nino 3.4 region.
Each ENSO phase has a different effect on the pressure and weather in the tropics. This translates to the overall global weather circulation with time, changing the weather patterns worldwide.
A specific phase (cold/warm) usually starts to develop between late summer and early fall and typically lasts until next summer. But some events can last even up to two full years.
The cold ENSO phase is called La Nina and the warm phase is called El Nino. The name La Nina translates to “the girl”, and the name El Nino translates to “the boy”, indicating an opposite dynamic between the two oceanic phases.
The ENSO phases are determined by looking at the sea surface temperature anomalies (warmer/colder) in the ENSO 3.4 region, which was presented in the previous image.
On the image below we have a direct comparison between the ocean temperature anomalies during a warm (El Nino) and a cold event (La Nina). Both examples show realistic data, from the 10 strongest events for each phase.
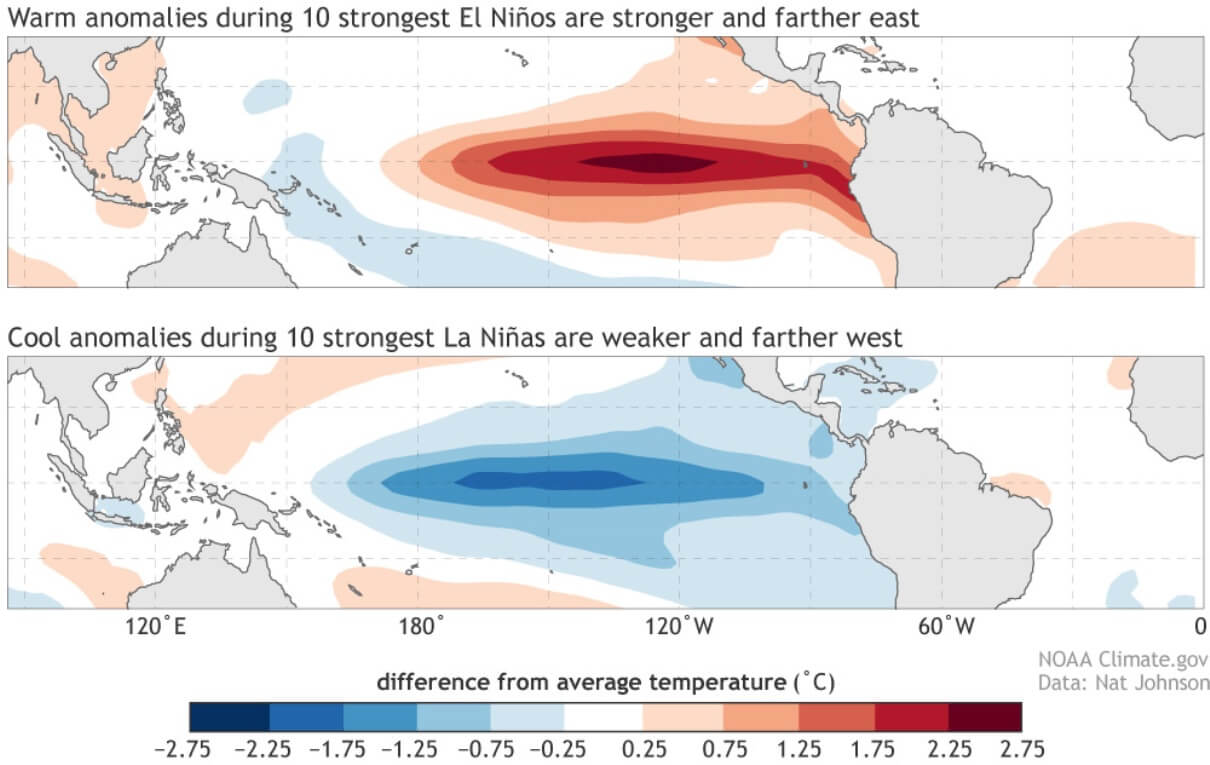
Typically, an El Nino develops stronger anomalies, which are focused more on the central and eastern regions.
But while La Nina has weaker peak anomalies compared to the El Nino, it typically peaks more from the central to the western region.
The image below from NOAA Climate shows the typical circulation during a cold ENSO phase (La Nina) that we are experiencing for the past two seasons. Air descends in the eastern Pacific, causing stable and dry weather, while air rises in the western Pacific, causing frequent thunderstorms and a lot of rainfall.
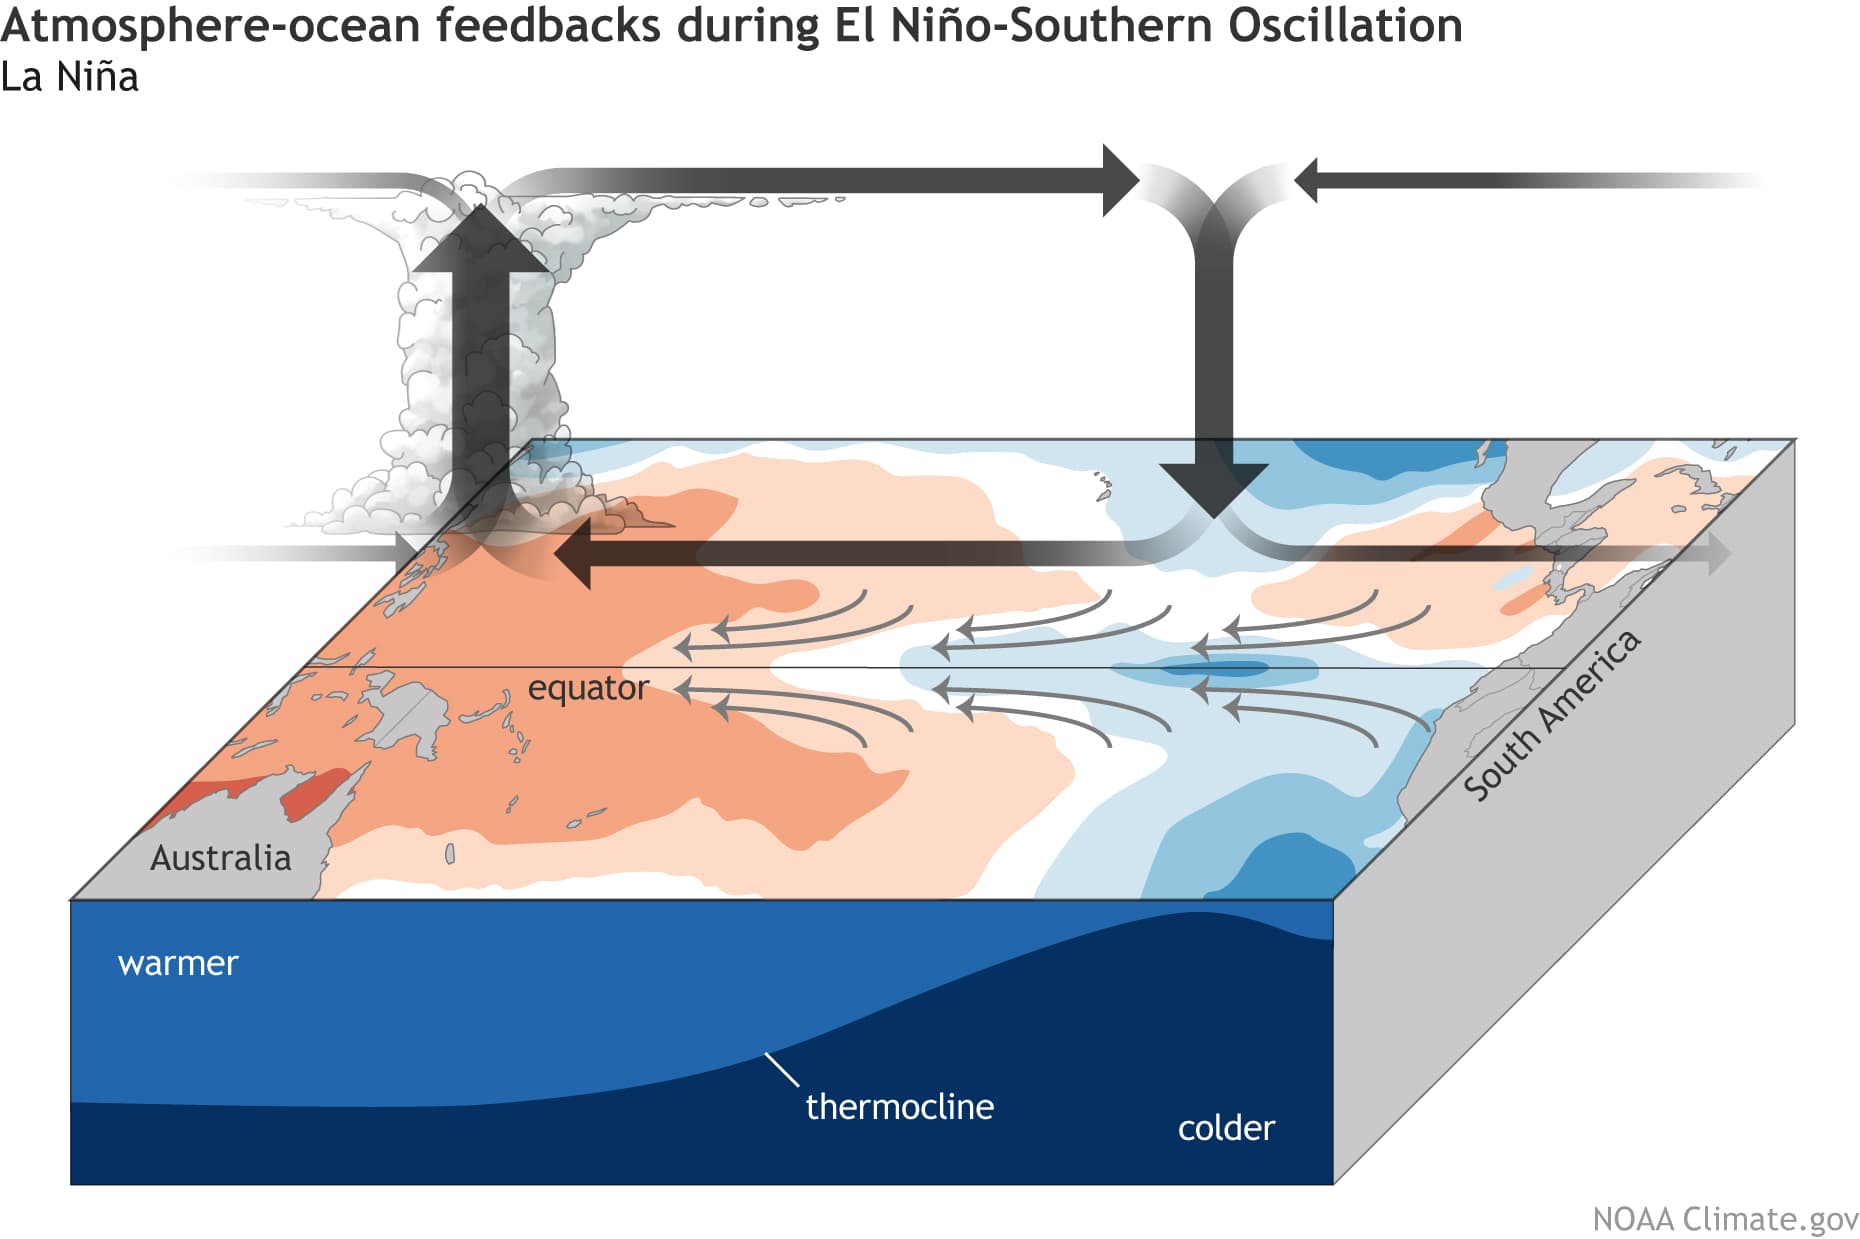
This way, ENSO has a major impact on the tropical rainfall and pressure patterns and impacts the ocean-atmosphere feedback system. Through this ocean-atmosphere system, the ENSO influence is distributed globally.
We usually observe a global shift in pressure patterns during the emergence and duration of the ENSO phases.
But why and how does ENSO shift between cold and warm phases?
There is no simple answer, but we can say that it is a result of the complex dynamics between pressure patterns and winds in tropical regions. The trade winds usually start or stop a certain phase, by mixing the ocean surface layers and changing the ocean surface currents.
What are the trade winds? The trade winds are steady, and persistent winds, blowing towards (and along) the Equator in both Hemispheres. The image below from Weather.gov nicely shows a simplified map of the global prevailing winds, with tropical trade winds, marked yellow and red.

Below is a map that also shows the prevailing near-surface winds, but based on the actual data from the past 4 decades. We can nicely observe the easterly trade winds in the Atlantic Ocean and in the Pacific Ocean, which also help to drive the ENSO region warming and cooling.
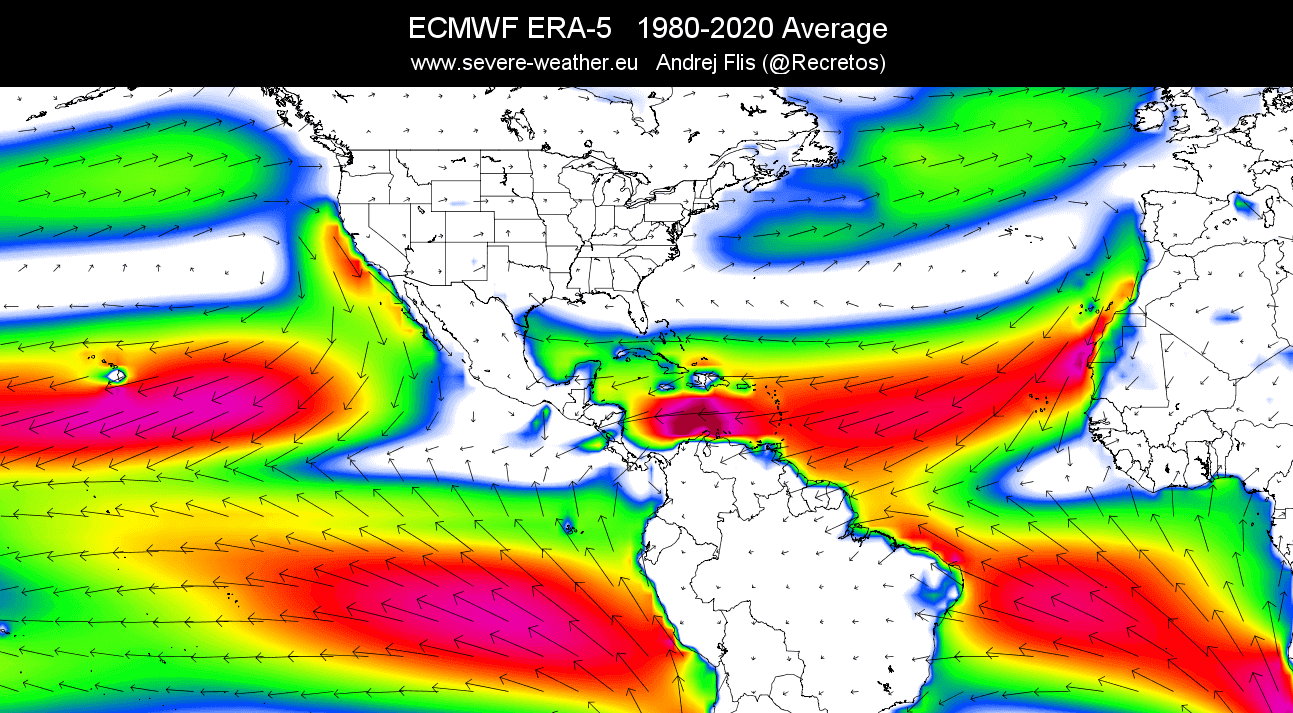
When these easterly winds get stronger, they actually start changing the ocean surface currents, and they start pushing the water from east to west. This moves warm surface waters towards the west, bringing deeper (colder) waters closer to the surface to replace it.
This process is much better seen on the video animation below, which shows the ocean temperature anomalies from Summer to late Fall 2021. You can see new cooling starting in July, as the “waveforms” develop across the equatorial Pacific. They are formed as the surface water is being pushed west by the trade winds, being replaced by deeper colder water.
The image below shows recent ocean surface currents and temperatures in the ENSO regions. We can still see easterly currents, which are pushing the water towards the west, cooling the ocean surface. The easterly regions are usually always colder than the western due to stronger trade winds.
But the key is not just in the winds themselves, as they are typically being driven by pressure changes. The ENSO phase directly responds to a special atmospheric pressure change, called the Southern Oscillation Index.
The Southern Oscillation Index or SOI represents the difference in air pressure measured at Tahiti (French Polynesia) and Darwin (Australia). The image below shows the location of the two pressure zones that are important for ENSO development.
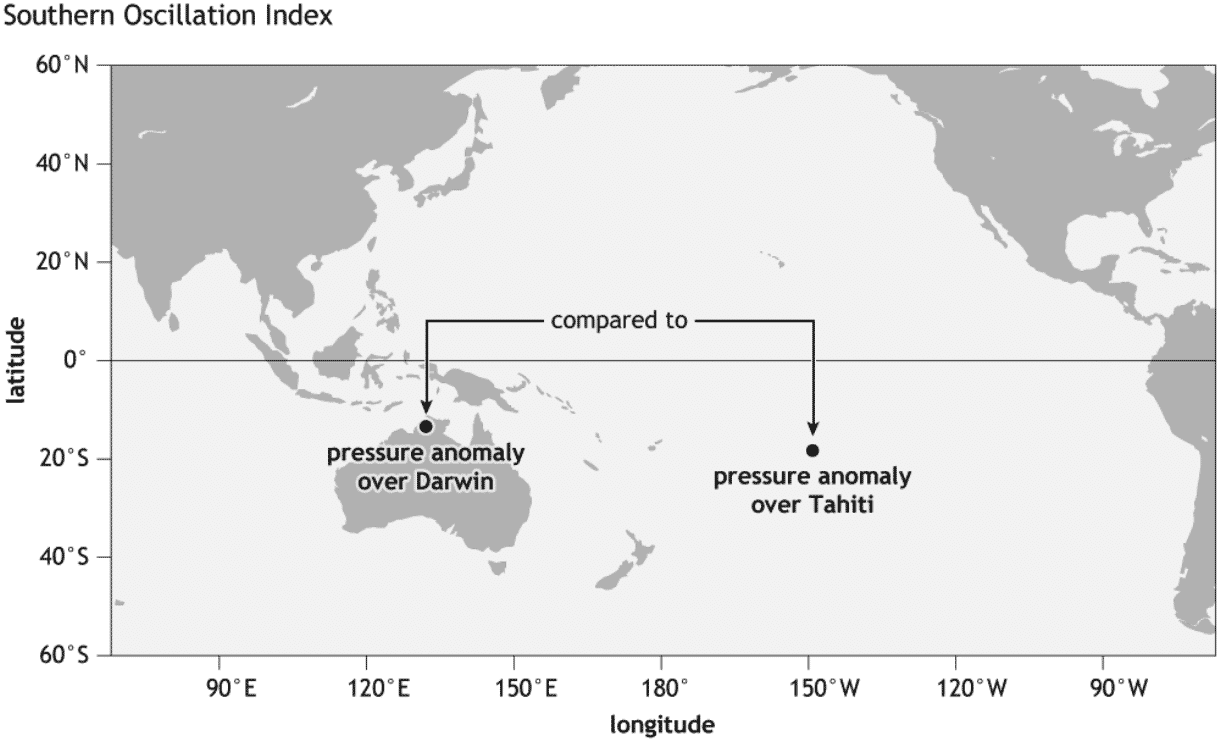
Positive SOI values mean that the pressure over the Tahiti side is higher than over Darwin in Australia. This corresponds to stronger easterly trade winds, supporting La Nina conditions.
But during an El Nino, we see lower pressure in the eastern Pacific and over Tahiti, and higher over Darwin, Australia. This produces a negative SOI value and weaker trade winds, which means less ocean cooling in the ENSO regions.
ENSO LATEST DATA EXAMPLE
Recent global ocean analysis reveals the presence of cold ocean anomalies in the tropical Pacific. This is the La Nina across the ENSO regions. The “wave-like” shapes of the cold anomalies indicate strong trade winds, pushing the surface waters from east to west, creating these ocean surface swirls.

You can also see the warm Gulf Stream ocean anomalies extending from the east coast of the United States into the far North Atlantic.
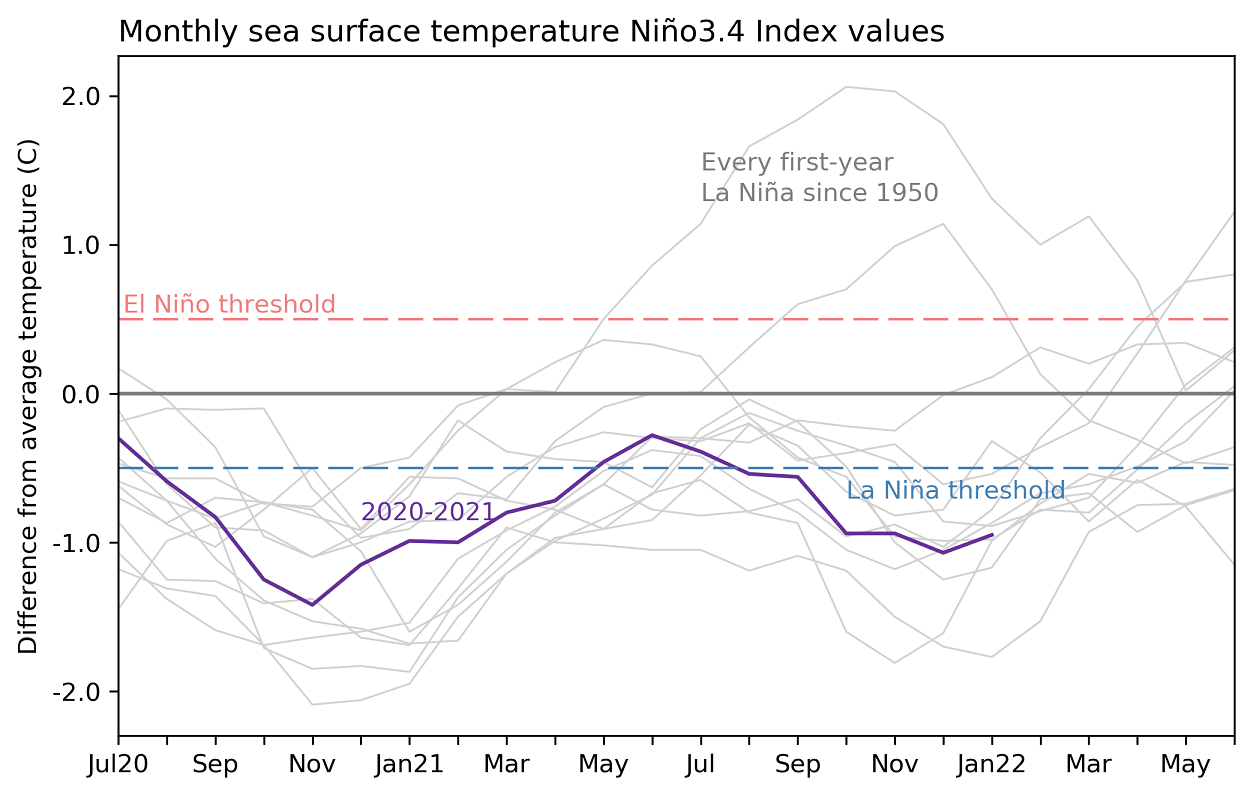
Focusing on ENSO region 3.4, you can see the first La Nina from the 20/21 season in the image below. New ocean cooling began in Summer and Fall last year. That was the development of the current cold phase. Peak cooling was weaker in the current La Nina, as the second-year event is usually weaker than the first event.
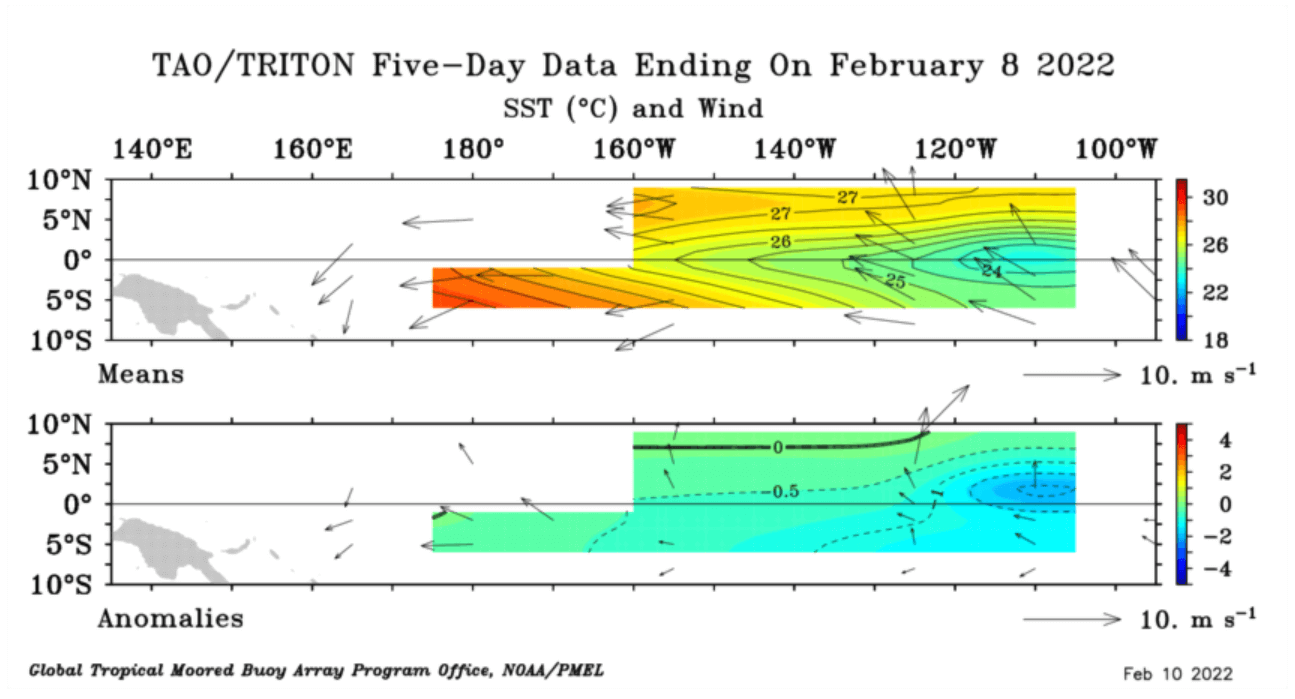
Below we have a closer view of the latest conditions in the ENSO regions. You can nicely see the cold ocean anomalies in the central Tropical Pacific, associated with the still ongoing La Nina. Peak cold anomalies are now focused more towards the eastern regions, where the trade winds are still stronger.

But perhaps a stronger (invisible) process is ongoing below the ocean surface. On the image below you can see the temperature anomalies by depth across the tropical Pacific Ocean. The top analysis is for late December and the bottom analysis is for mid-January.
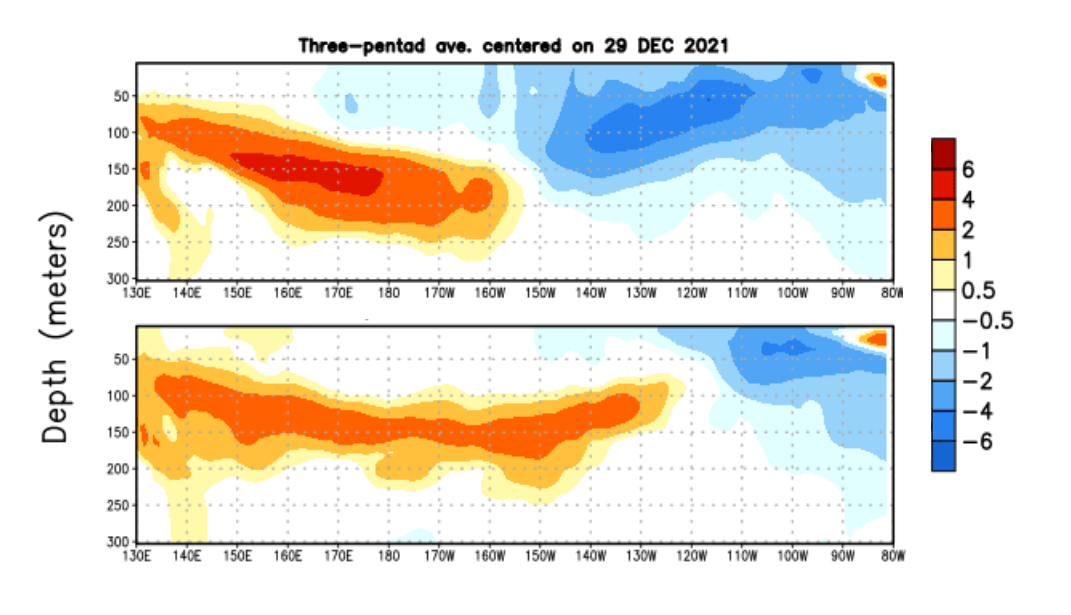
We can see a strong warm wave expanding below the ocean surface from the west, at around 80-200m depth. This is known as an oceanic Kelvin wave, and this is currently causing the breakdown of the La Nina.
Looking at the latest high-resolution depth analysis under the ENSO regions, we still see colder than normal temperatures below the surface in the eastern region. But the warm anomalies have completely taken over.

Oceanic Kelvin waves usually stop a cold ENSO phase and can start a warm ENSO phase in late summer and early Fall. So it is important that we take notice of the dynamics below the ocean surface as well, not just on the surface.
One way to look at the whole ENSO region temperature strength is by looking at the ocean heat content. This takes the water at depth into consideration, not just the surface temperatures, showing the temperature anomaly tendency for the entire upper ocean layer.
And below we can see the cold anomalies developing in late Summer, and peaking in mid-October. Lately, the subsurface cold anomalies have weakened, indicating that the La Nina is already gone below the surface, as the warm Kelvin wave is moving across.

Based on all the available data, an official La Nina watch is still in effect, released by the NOAA’s Climate Prediction Center:
“La Niña is likely to continue into the Northern Hemisphere spring (77% chance during March-May 2022) and then transition to ENSO-neutral (56% chance during May-July 2022). La Niña is anticipated to affect temperature and precipitation across the United States during the upcoming months.”
ENSO AND WEATHER
Tracking the weather effects of these ENSO phases is not that easy. It is not as simple as pointing at a certain weather event and simply calling it “ENSO influenced”.
Global weather is a very delicate and complicated system, where everything has an influence on everything. But of course at quite different temporal and spatial scales.
As we have been in the La Nina season for the past 2 years, we will look at the average winter pressure pattern from multiple La Nina winters. The main feature is a strong high-pressure system in the North Pacific and low pressure over Canada.
That is the typical signature of the cold ENSO phase. Over Europe, we see lower pressure over Scandinavia and higher pressure over northwestern Europe, but that cannot be designated as a typical weather response from the La Nina.
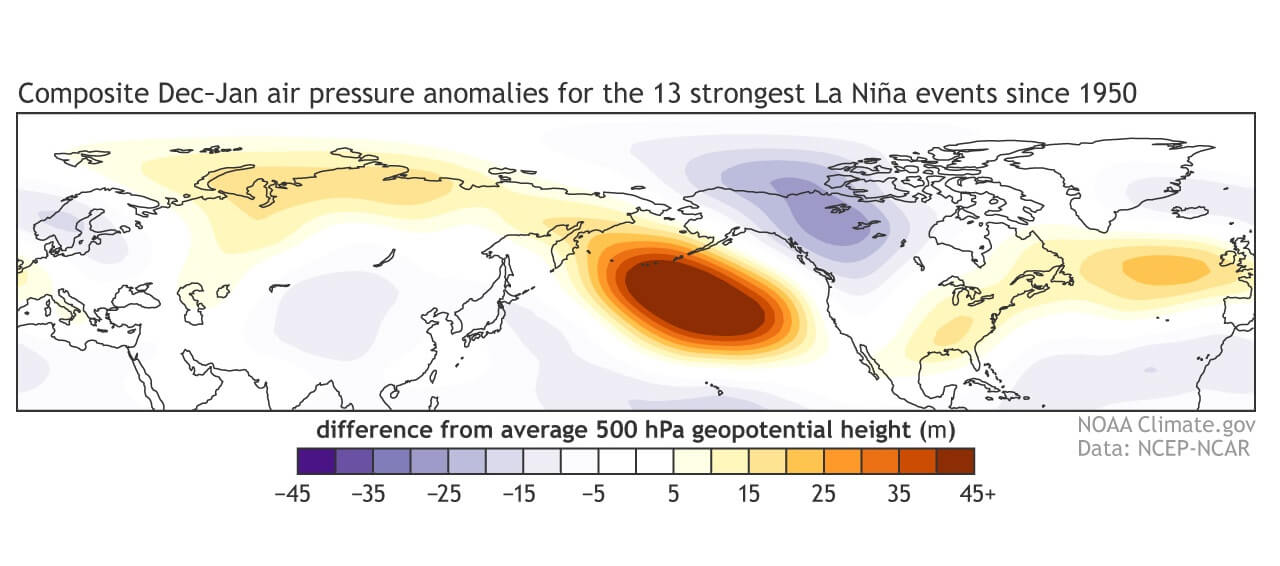
The main takeaway is the strong high-pressure system in the North Pacific and lower pressure over western Canada and the northwestern United States. That sends the polar jet stream down over the northern United States.
But over Europe for example, the direct La Nina influence slowly fades, due to the generic weather pattern variability. The influence is still there, but it is typically highly modified by the existing weather patterns in the North Atlantic and over Greenland.
This is exactly what we have seen this Winter season 2021/2022. Below we have a pressure anomaly analysis of the winter season 2021/2022 so far. Notice the strong high-pressure system in the North Pacific, and the low-pressure zone over Canada.

The jet stream is bending between the two systems from Alaska down into the northern United States. This is an average picture from the start of the meteorological winter season on December 1st to the latest data available on February 8th.
We can see the strong high-pressure system in the North Pacific, which is the typical weather effect of a cold ENSO phase (La Nina). So this way we can see how these ocean anomalies actually infiltrate into the global weather circulation.
In our next articles, we will be taking a much closer look at each specific ENSO phase, the La Nina and the El Nino, and how they impact our weather on a seasonal scale. So make sure to bookmark our page, to stay up-to-date with the latest educational articles on nature and weather in general.